| Home | Our Services | Relational Analysis and Visualization |
![]()
Additionally, we have specialist capacity in a number of specific areas of operational risk i.e. Procurement & Supply Chain; Retail Banking; & Mining.
Relational Analysis and Visualisation (Sentinel™)
The Relational Analysis and Visualisation (Sentinel™) software that we utilise provides a powerful new generation of visualisation and analysis capabilities. With a wide variety of tools, it allows you to find new insight, patterns, and trends hidden in existing data leading to accurate and actionable intelligence.
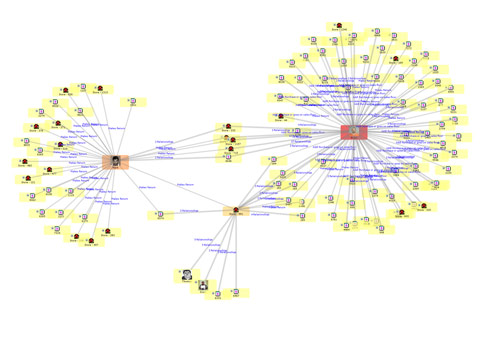
Visualisation
- Find hidden relationships
- Quickly identify clusters and patterns
- Perform ad-hoc analysis
- Organise complex networks
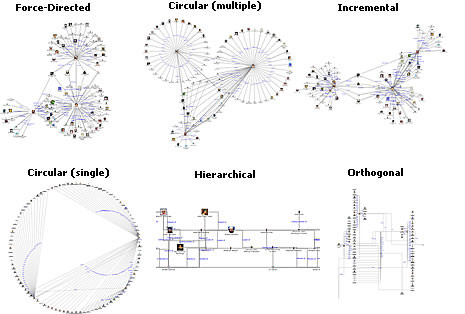 |
Flexible Visualisations
The Relational Analysis and Visualisation (Sentinel™) softwarethat we utilise provide 2D and 3D network link charts.
- Automatically build network charts with complete control over layout and appearance.
- Query the knowledgebase for entities and relationships, and the system automatically organises the data into a coherent and visually clear network.
- With Visual Styles, we have complete control over every aspect of appearance, including images, colours, fonts, and line styles. Full support is included for panning, zooming, and ad-hoc data analysis.
 |
Direct Knowledgebase Integration
Since the visualisation surfaces are connected to your knowledgebase, you have immediate access to comprehensive information about any object in the network. Click on an entity and display all its narrative, metadata and linked content. The Details pane provides quick access to the key data points for entities and relationships.
Analysis
All data has hidden meanings, patterns, and trends, but identifying them is a challenge that only advanced automatedanalysis can address. The Relational Analysis and Visualisation (Sentinel™) softwarethat we utilise offers some of the most sophisticated analytic capabilities available.
With the Tool, we utilise automated Analysis which lets you:
• Automatically identify central players
• Locate organisational cut-points
• Perform timeline analysis
• Organise data relationships into cells and cliques
• Include your own metadata in the analysis process
• Find all paths, the shortest path, or the best paths between two entities
• Build simple or complex models that mirror your needs
Automated Analysis
With the Tool, we utilise Automated Analysis which lets you:
- Automatically identify central players
- Use Social Network Analysis (SNA)
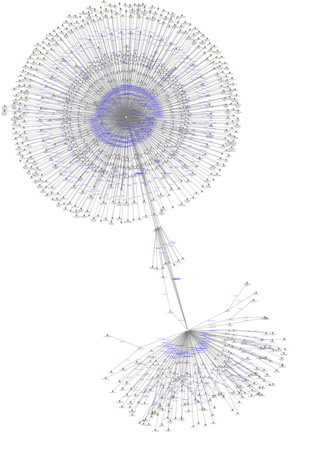 |
Network Metrics
The Relational Analysis and Visualisation (Sentinel™) softwareincludes Network Metrics — the advanced technology for identifying, grouping, and ranking complex interrelated data. With a foundation in Social Network Analysis (SNA), the system provides:
- the ability to rank centrality
- closeness
and other key metrics even within large complex data sets. Unlike other SNA-based systems, Network Metrics extends the analysis model by assigning specific meaning and weighting that models your data and mission.
The Big Picture
Network Metrics are generated as a set of sortable numbers — you can quickly see central or highly connected players in a network. The Relational Analysis and Visualisation (Sentinel™) software takes this capability to the next level with Gradient Metrics—the ability to automatically apply numeric rankings to the visual appearance of the network. You can specify colours for high and low values, and the Tool does the rest. This feature makes it easy to visually acquire meaning in even the most complex inter-related data.
Finding Paths
How are things connected? What connection paths do people work through? What is the shortest or best path between two data elements? The Relational Analysis and Visualisation (Sentinel™) software provides avariety of tools that make it easy for you to answer such questions. With highly optimised graph algorithms, you can quickly see all paths, the shortest path, or only the best paths between entities based on your specific criteria.
Temporal Analysis
The Relational Analysis and Visualisation (Sentinel™) software provides a powerful Time Range interface that hides or shows data based on a time slider control. Temporal Analysis makes it easy to see how networks form, change, and interact with each other overtime. This capability allows you to spot patterns and predict actions and behaviours. The Time Range interface supports ranges down to the second level, and includes the ability to visually define time spans and ranges.
Key Nodes, Cliques, and Cells
By analysing the results of network statistics, the Relational Analysis and Visualisation (Sentinel™) software provides additional tools that help you find meaning in your data. The Tool pinpoints and providesa visual representation of cliques i.e. groups of entities within a network that are closely connected to each other. The Tool also locates and displays cut points,or entities whose removal would seriously disrupt or completely destroy the link between sub-groups and gives us unprecedented accuracy through weighting. The Tool gives you the abilityto accurately model simple or complex systems by specifying the weight ofentity and relationship types, information credibility, and a variety of other parameters.
Should you require further information contact us hereor visit sentinel visualizer.
 |